


Six Months Up and Counting: Stocks Rally as AI Spending and Earnings Power the Bull Run
- Markets kept climbing through October, even as the government shutdown left investors flying blind on key data.
- AI momentum, strong corporate profits, and new tax stimulus hint at a surprisingly resilient economy heading into 2026.
- Beneath the surface, uneven consumer health and widening wealth gaps show this rally isn’t lifting everyone, all ahead of a mid-term election year
Stocks extended their monthly winning streak to six. The S&P 500 added 2.3% in October, ending the first month of Q4 at a record monthly high. The Nasdaq Composite outperformed, thanks to the Magnificent Seven tech names scaling new heights. Small caps and international stocks also staged strong October rallies, all while the U.S. government was closed for business.
October Returns: S&P 500 +2.3%, Nasdaq +4.7%, Small Caps +1.8%
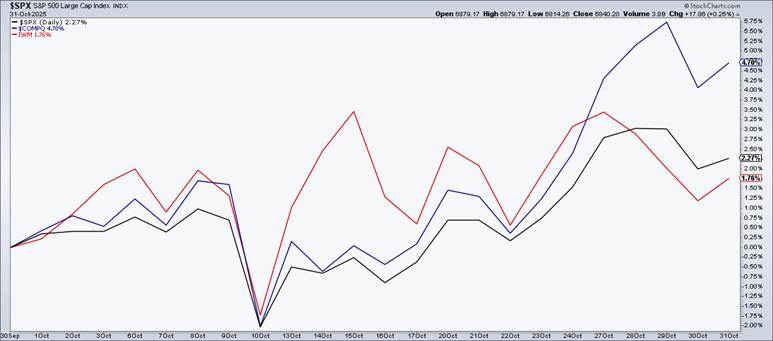
Source: Stockcharts.com
Q4 Begins on the Front Foot
We were optimistic heading into the fourth quarter. Markets had defied bearish August and September trends, which signaled possible continued strength heading into 2025’s final stretch. That broadly played out, but it didn’t mean that volatility was utterly absent.
Indeed, with a dearth of official data due to the ongoing government shutdown, investors and policymakers were largely operating in the dark regarding the state of the labor market, the health of the consumer, and the latest inflation trends. That, and brief trade jitters, drew a short-lived VIX spike mid-month.
Shutdown Seen Lasting 46 Days (to November 16)
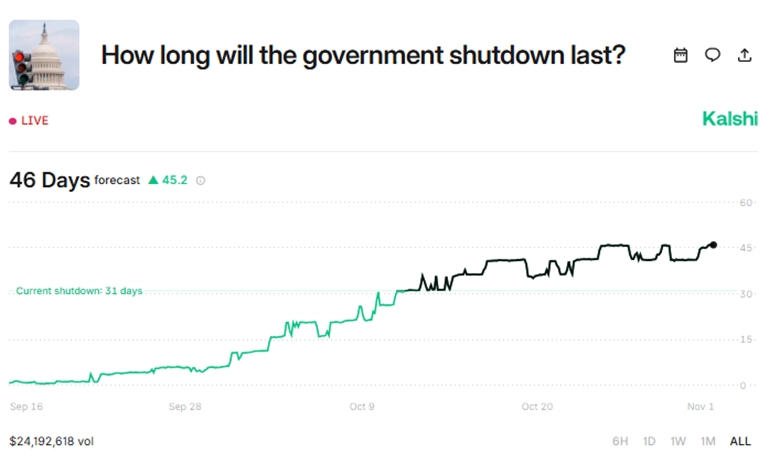
Source: Kalshi
Equities as Discounting Mechanisms
Stocks didn’t seem to care much about the lack of data, and that brings up a crucial point: equities are discounting mechanisms, meaning that current concerns are often bypassed, and risks and opportunities many months ahead are what really matter. As it stands, 2026 could be bright—for a few reasons.
Why 2026 Could Shine
- Fiscal Boost
Next year’s first quarter is likely to feature $91 billion of what may effectively be stimulus. The new One Big, Beautiful Bill Act (OBBBA) maintained payroll withholding amounts for 2025, resulting in larger-than-usual tax refunds for American families when they file their returns. The average refund is about $3,200, and estimates suggest that next year’s average could jump to nearly $3,800. That’s welcome relief, particularly for struggling lower-income households.
Bigger Refunds Coming
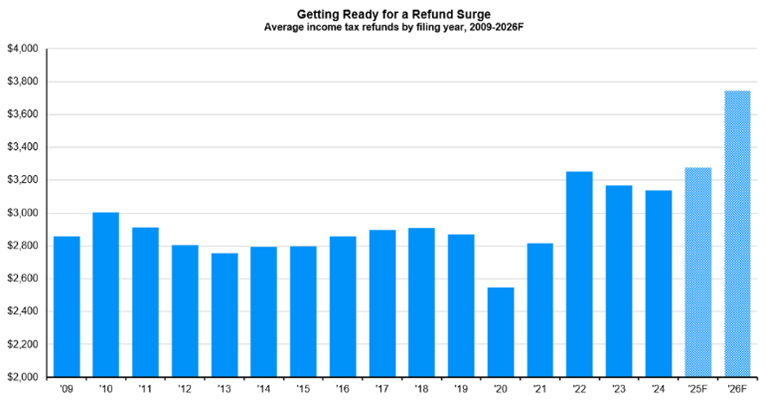
Source: J.P. Morgan Asset Management
Corporate Earnings Strength
Corporate profits are like a freight train. Added liquidity for consumers is nice, but ultimately, it’s earnings per share that drive stock returns. According to FactSet, S&P 500 companies are expected to collectively grow their EPS by 11.2% this year—very strong. In 2026, though, the forecast growth rate is an even better 14.0%. So, while some critics contend that the stock market is in a bubble, the truth is that there are real revenues and profits to back it up (the same couldn’t be said back in 1999 and 2000).
S&P 500 EPS Growth Expected to be Strong in 2025 and 2026
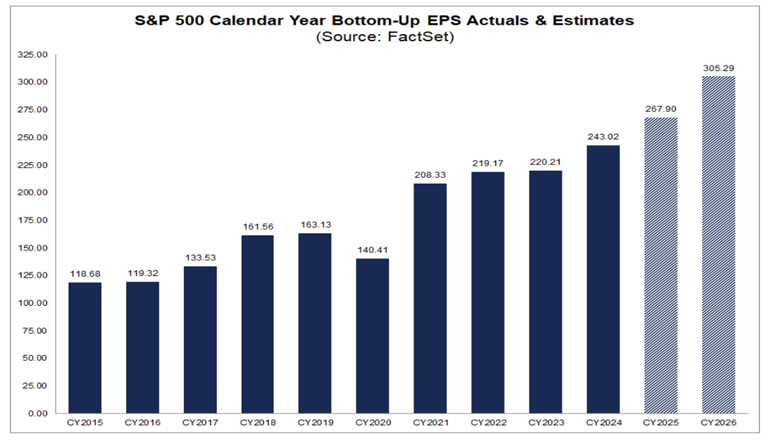
Source: FactSet
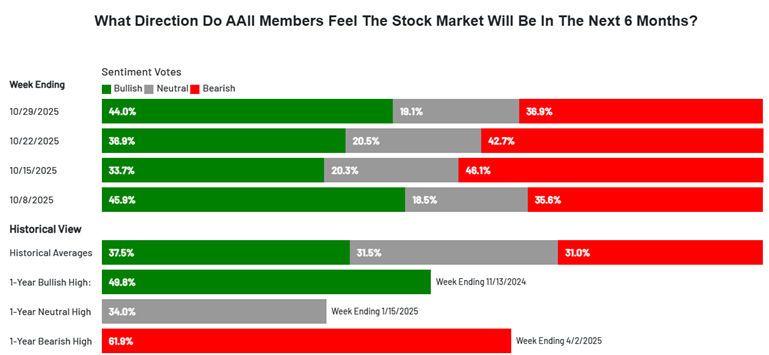
Sentiment Still Skeptical
This one is admittedly squishier—investors just seem to hate this bull market. We are now in year four of the bull market (ChatGPT’s third birthday is November 30, by the way), but skeptics remain numerous across Wall Street. Recent sentiment surveys put out by the American Association of Individual Investors (AAII) reveal that only about half of market participants are bullish about the next six months. When a rally is doubted rather than embraced, that commonly leads to higher prices. We’ll see if that translates into a fourth straight up year in 2026.
AAII: Lukewarm Bullish Sentiment
Source: AAII
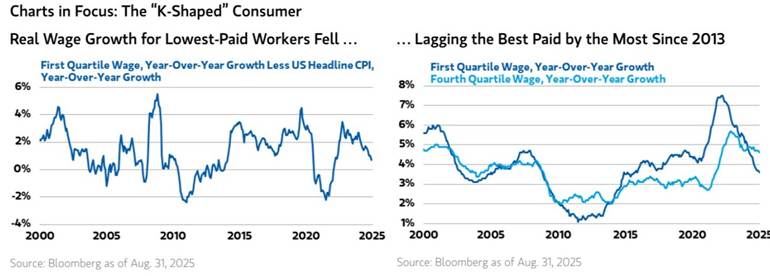
The K-Shaped Economy
Of course, it’s not all rainbows and unicorns out there. As we approach the holidays, it’s clear that not everyone is experiencing joy. As mentioned earlier, the bottom half of the wealth spectrum is on thinner ice compared to, say, 2021 (when stimulus programs were in full force and lower-income wage gains were starting to go vertical). Today, there’s increasing chatter about a “K-shaped” economy, in which there are haves and have-nots.
That narrative has been underscored by the government shutdown, which now impacts families who receive financial benefits from the SNAP program (previously known as food stamps). The cold, hard truth is that a growing wealth divide is more of a political hot potato than an immediate risk to the stock market. It’s just a reality that so long as the richest 10% keep spending, economic growth is likely to endure.
A Growing Wage Divide
Source: Morgan Stanley
Reading the Real Economy
That brings us to what’s going on with the “real” economy (what’s happening on Main Street). Amid the shutdown, there is no live official unemployment rate or monthly jobs numbers to parse. That’s welcome news for casual investors who may be lulled to sleep by such dry reports, but it’s troublesome for nerdy economists and market watchers.
Have no fear—there are plenty of so-called “alternative” data outlets, some new and some longstanding, that offer insights into the jobs situation, consumer activity, and the inflation backdrop. Let’s dig into those.
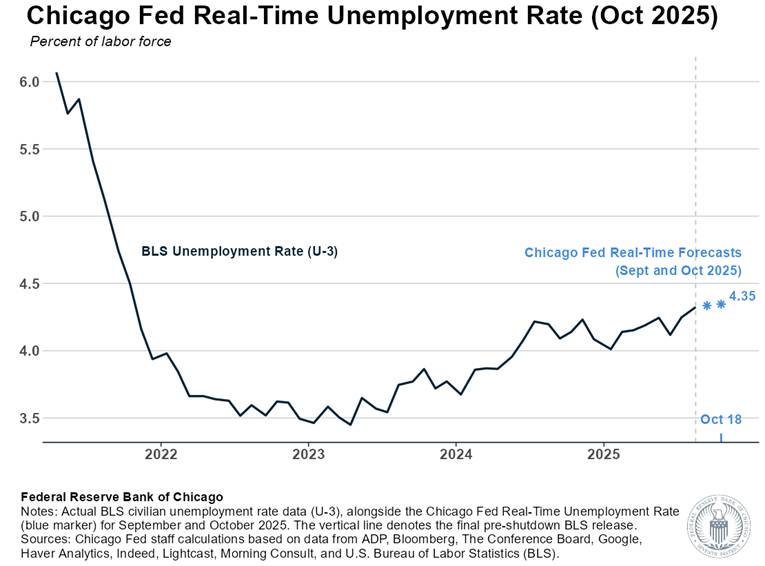
Labor Market Signals
According to the Federal Reserve Bank of Chicago, the real-time estimated unemployment rate has ticked up to 4.35% as of mid-October. To be clear, that’s low by historical standards, and it has not spiked as some brazen experts had expected. Compare 4.35% to this time in 2022, however, and it’s clear that employers have more of an upper hand.
Chicago Fed: A 4.35% Estimated Unemployment Rate
Source: Chicago Fed
What’s more, wage growth has cooled to near 4% (weaker for lower-income workers), the number of job openings has fallen hard, and the so-called “underemployment” rate rose to near four-year highs as of the last look. The offset is a labor pool that is no longer growing, primarily due to the Trump administration’s immigration policies.
Wage Growth Drops, Particularly for Low-End Workers
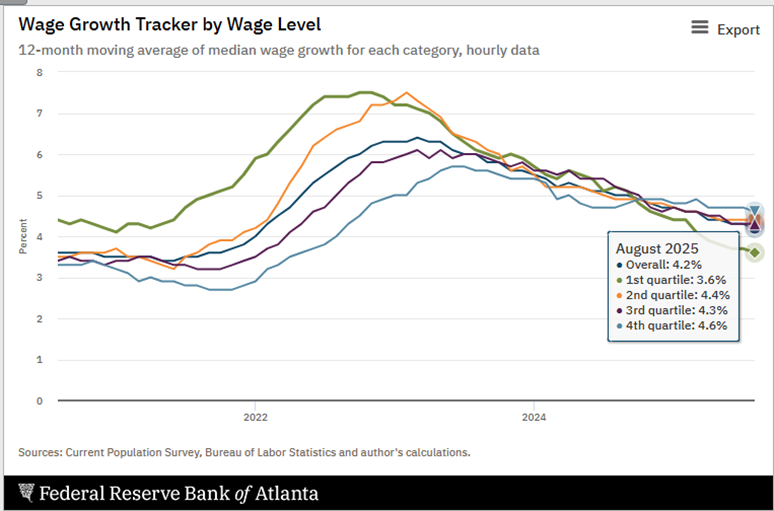
Source: Atlanta Fed
The Chicago Fed’s unemployment rate estimate is a new tool. So too is a weekly report published by payroll processor ADP. The company is known for its monthly survey of private-sector job change trends, and it took advantage of the shutdown to gain more granular insights. Its weekly view is encouraging. It indicates that, after a midyear hiring slowdown, there has been a modest bounce back in job creation. Going forward, new data will be released each Tuesday morning by ADP.
ADP Weekly Jobs Report: Mildly Positive Trends
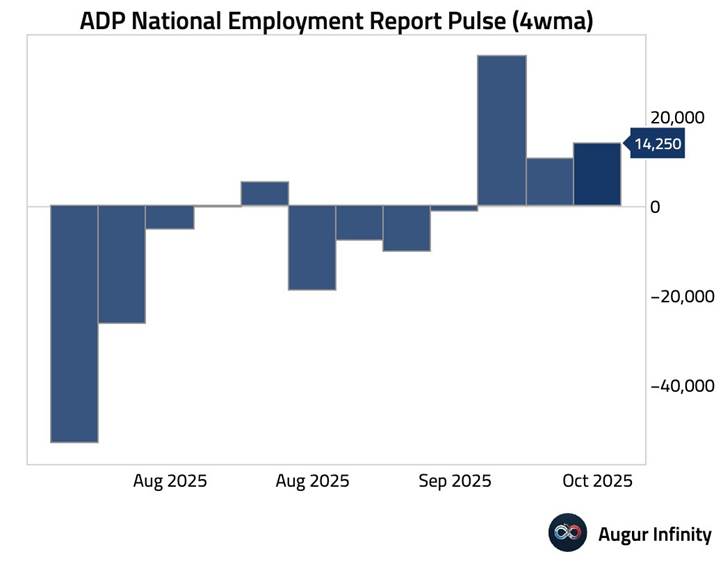
Source: Augur Infinity
And then there’s state-level initial jobless claims data. Wall Street firms are quick to gather and measure them. So far, first-time applications for unemployment benefits have remained stable and are certainly not indicative of a recession.
Initial Jobless Claims Estimate: Steady Near 220k
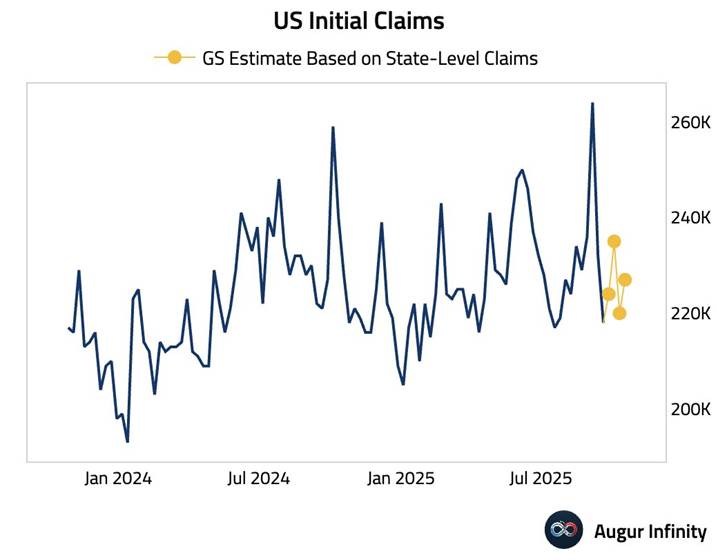
Source: Augur Infinity
Consumers Keep Spending
Turning to the consumer, normally, the monthly Retail Sales report (put out by the U.S. Census Bureau) is released mid-month. With it erased from the economic calendar, we must look elsewhere for aggregate spending trends.
Alas, there’s the Johnson Redbook retail sales report. This is another “high-frequency” update, printed every Tuesday morning. The most recent reading shows a 5.2% year-on-year increase in retail sales. That’s a healthy growth rate, given that inflation is about 3%.
Johnson Redbook: +5.2% Retail Sales Growth
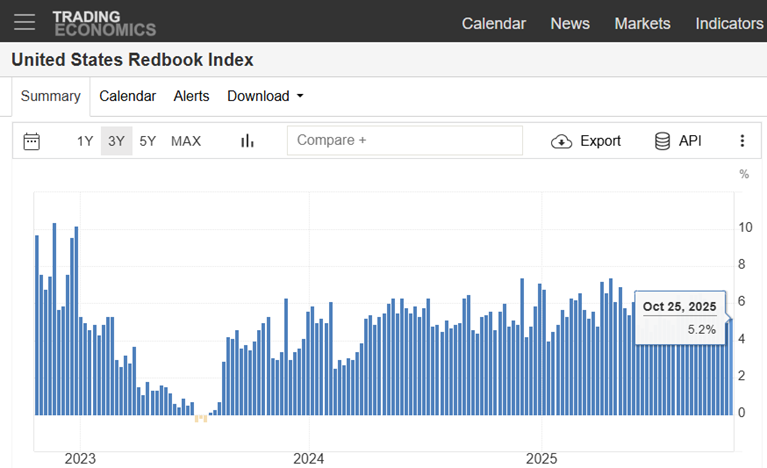
Source: Trading Economics
Inflation and Alternative Measures
As for inflation, we actually did get the official September Consumer Price Index (CPI) report in late October. It confirmed 3% inflation, both on the headline and core rates (core removes the volatile food and energy components). We’ve proven that private-sector and alternative data sources provide value, and there are a pair of nonstandard inflation barometers pointing to lower actual inflation:
- Truflation: Prices up 2.7% year-on-year
- WisdomTree Estimate: Real-time housing data suggests inflation near 2%
- CPI (Official): 3% headline and core
Truflation Rising, But Below 3%
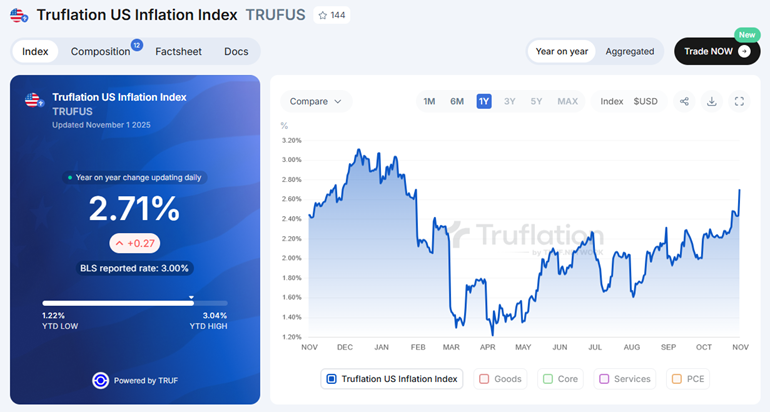
Source: Truflation
WisdomTree: U.S. Inflation Closer to 2%, Using Real-Time Shelter Prices
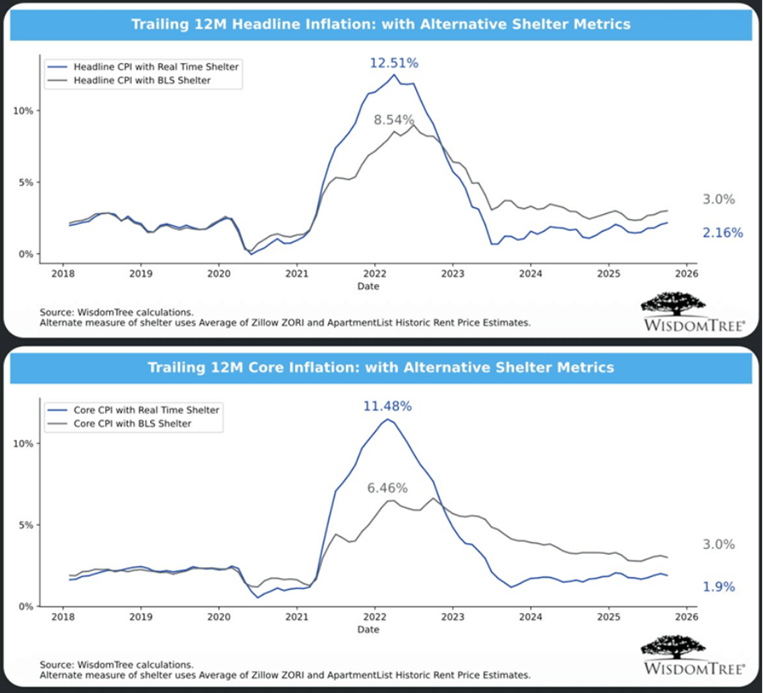
Source: WisdomTree
Fun with numbers? Maybe. But these are worth a closer look during the shutdown (which prediction markets expect to last a record 46 days.
AI-Fueled Market Momentum
All of the above—the jobs situation, consumer spending, and inflation—obviously matter to markets. Arguably, the more powerful force sending stocks to new records is AI. We are wrapping up the Q3 reporting season, and earnings for big tech companies have been stellar.
Investments in semiconductor chip procurement, data center buildouts, and power generation are skyrocketing and are expected to continue growing in the years to come. Last month, we called out concerns about so-called “vendor financing,” a sort of circular cash flow washing machine in which a company like NVIDIA would invest in an AI developer like OpenAI, and then OpenAI would turn around and buy more chips from NVIDIA. There’s no letup in that activity as the AI arms race only gets hotter.
In October:
- NVIDIA shares gained 8.5% (briefly topping $5 trillion in market cap)
- Apple added 6.2%
- Alphabet and Amazon both posted double-digit monthly advances
- Microsoft and Tesla lagged
- Oracle gave back part of its September surge
- Meta was the lone blemish post-Q3
AI Leaders’ October Performance Trends
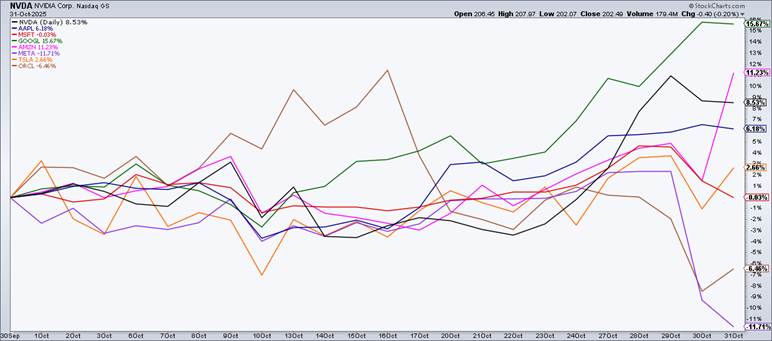
Source: Stockcharts.com
The Fed and “Jensen vs. Jay”
The quip of the month was that Jensen mattered more than Jay. In other words, Jensen Huang (CEO of NVIDIA) had more of a market impact than Jay Powell, chairman of the Federal Reserve.
On that note, the Fed cut its policy rate for the second straight month—sort of an “insurance” cut in case employment trends were turning south. There was dissent in both directions among the 12 voting members on the Federal Open Market Committee (FOMC):
Stephen Miran (recent Trump appointee and loyalist): Voted for a 0.50% cut
Jeff Schmid (Kansas City Fed): Voted for no cut
Following the October 29 FOMC decision, a growing chorus of Fed members cautioned that continuing to lower interest rates could result in inflation running too high above their 2% target. That seemed to back up what Powell underscored in his post-meeting press conference. Rather than sticking with the usual refrain that the Fed will be “data dependent,” he said a December rate cut is “not a foregone conclusion—far from it.”
That temporarily spooked stocks and sent interest rates higher into the end of the month. But with Powell’s term ending on May 23, 2026, the presumption is that he will be succeeded by a more dovish new leader who will seek more aggressive cuts. Lots of drama is set to unfold on that front over the months ahead. Stay tuned.
10-Year Treasury Note Yield: Trending Lower, But Jumped Post-Fed in Late October
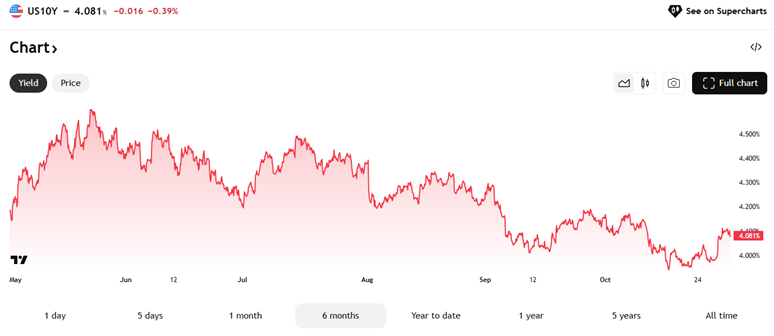
Source: TradingView
Growth Still Solid
All the while, the U.S. economy is humming along at a better-than-3% annualized growth rate (after inflation). That’s a robust clip, particularly as there’s some doubt about consumer health. If AI spending keeps up, the new tax law stokes increased business investment and consumer demand, and interest rates creep lower, then 2026 could be a year of more broad-based economic expansion. It’s far from a sure thing, though. We’ll know much more when the government reopens and fresh official data comes in fast and furious once again.
Q3 GDP Growth Estimated at 3.9%
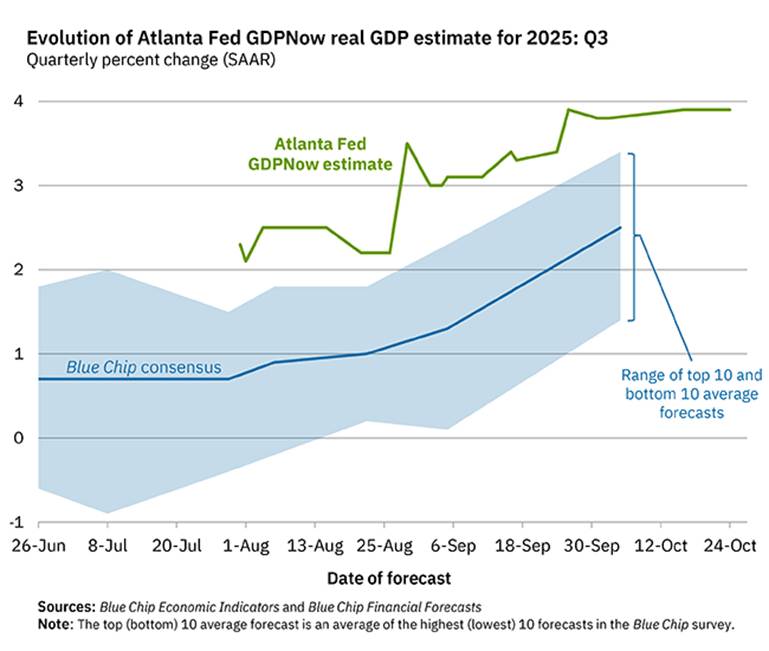
Source: Atlanta Fed
The Bottom Line
Stocks rose once again in October. The string of monthly gains reached six… seven could happen in November (there, I said it…if you don’t know what I’m talking about, ask your kids to read this closing paragraph).
Serious matters are at hand, namely the government shutdown and stubborn inflation. The K-shaped economy is poised to be a political hot-button issue in 2026, a midterm election year. For now, corporate earnings growth appears strong, and the AI-fueled bull market rages on.