


Markets Went Nowhere in February—But Under the Hood, Everything Changed
- The S&P 500 finished February flat, but global stocks, SMID caps, and commodities told a very different story
- Defensive sectors surged, the Mag 7 stumbled, and bond yields fell—signaling a rotation beneath the surface
- Elevated volatility, emerging credit risks, and shifting leadership suggest 2026 may be more turbulent than headline indexes imply
We can sum up the first two months of the year in one word: nothing. The S&P 500 (SPX) is virtually flat so far in 2026, all while intense action brews beneath the market’s surface, around the world, and now geopolitically.
In February, the SPX shed 0.9%, but most global stocks posted solid gains. The bearish story was told via the Nasdaq Composite, which gave back 3.4%. Indeed, the Magnificent Seven posted deep red numbers, save for Apple’s 1.8% advance.
S&P 500 Unchanged YTD
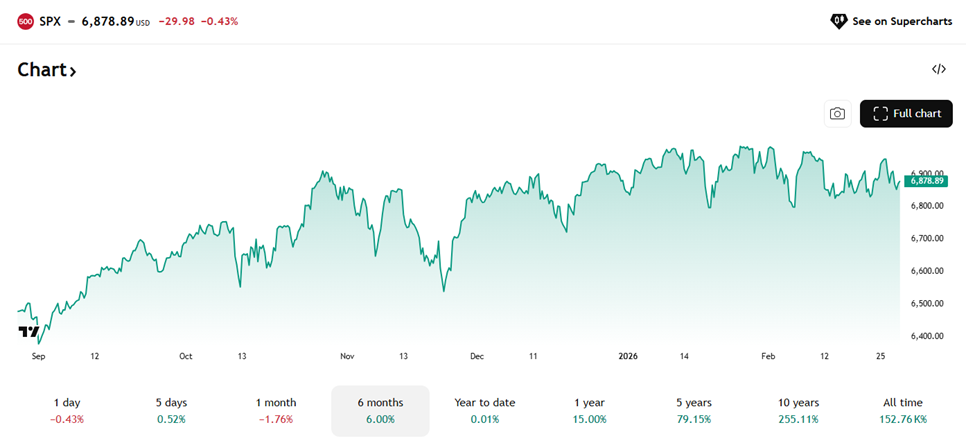
Source: TradingView
The likes of NVIDIA, Alphabet (parent company of Google), Microsoft, Amazon, Meta, and Tesla registered declines of 6% to 12%. Zoom out, and the so-called “average U.S. stock” tallied strong gains. The S&P 500 Equal-Weight Index ended last month at a fresh record high, up 3.5% during what is notoriously a tough month.
International markets boasted big rallies, too. The All-Country World ex-US Index climbed 5.2%, notching an all-time high of its own.
S&P 500 February Returns: Mag 7 Deep Red, Most Stocks Up
Source: Finviz
Diversification and dispersion were the stock market passwords during the first quarter’s middle month. The bond market, meanwhile, finished in the green. The yield on the benchmark 10-year Treasury note fell below 4% last Friday, the lowest since September 2024 (when the Federal Reserve began cutting interest rates).
Lower yields mean higher bond prices, so investors in a balanced 60/40 stock/bond portfolio are sitting pretty heading into March.
10-Year Treasury Yield Below 4%
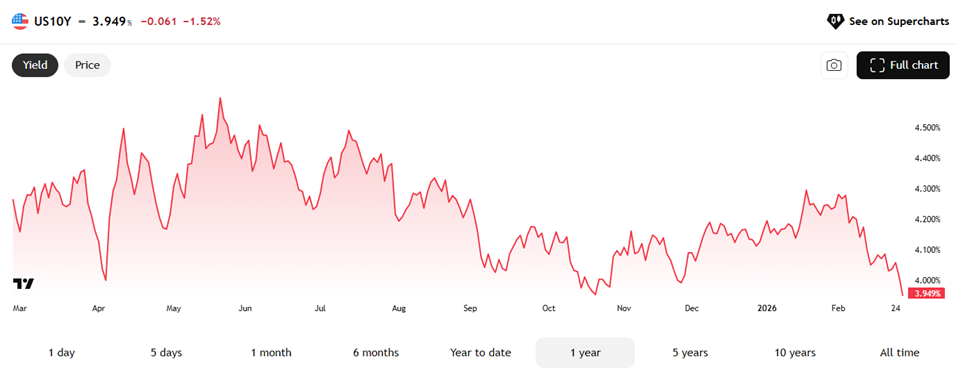
Source: TradingView
Amid rangebound S&P 500 price action, all is not quiet in the oil patch. U.S. and international crude oil printed highs dating back to last summer, and this past weekend’s coordinated military strikes on Iran only further lifted those markets.
It comes as the average price for a gallon of regular unleaded creeps back up toward $3. It’s increasingly likely that $3.30 or so at the pump could be in the cards as we approach Easter.
Oil Rallies as US-Iran Tensions Heated
Source: TradingView
As geopolitical tensions escalated, gold and silver actually flew under the radar. The yellow metal posted its best monthly close in a month, rising 8% in February. The steep late-January drop now feels like ages ago to those with sizable precious metals positions. Silver remains well below its absolute peak above $120 per ounce, however.
Gold’s Keeps Shining
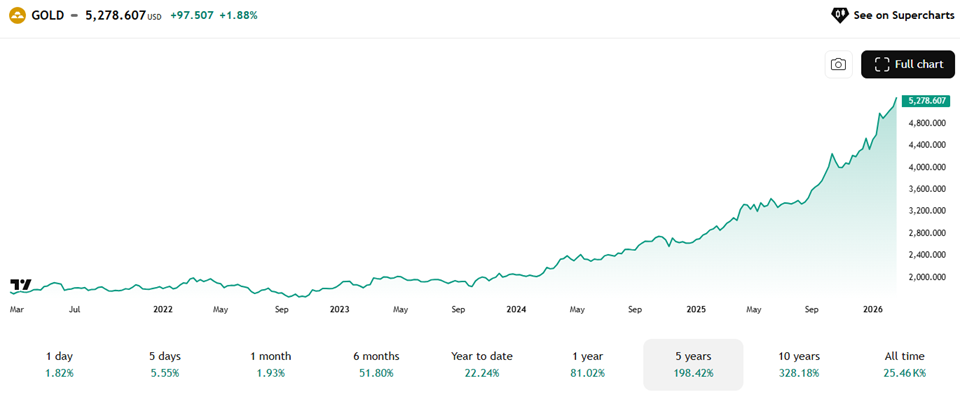
Source: TradingView
To recap price action so far, global stocks are near record highs, the bond market has been in rally mode throughout 2026, and commodities are generally going up and to the right. What has not been in favor? Crypto.
Bitcoin and ether fell again in February, with losses accelerating in the wake of the Middle East conflict. At home, turmoil in the tech-software industry cascaded into crypto in a “sell first, ask questions later” environment. With gold about $5,300 per ounce, bitcoin hovers near $64,000 per token, down 27% YTD.
Bitcoin Sinks Toward $64,000
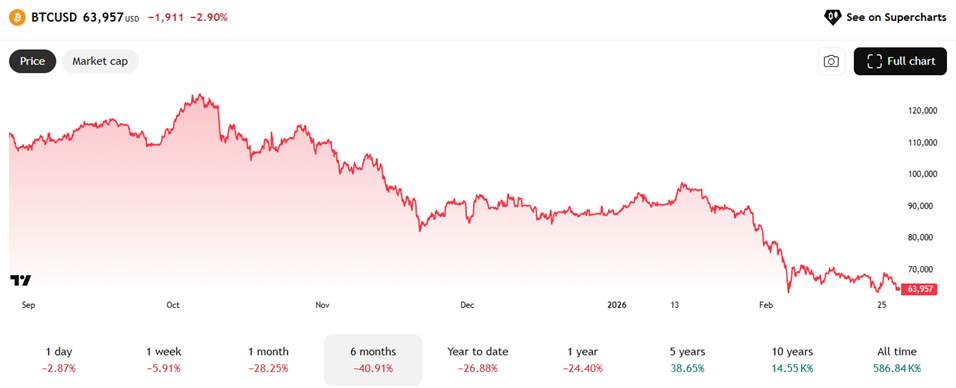
Source: TradingView
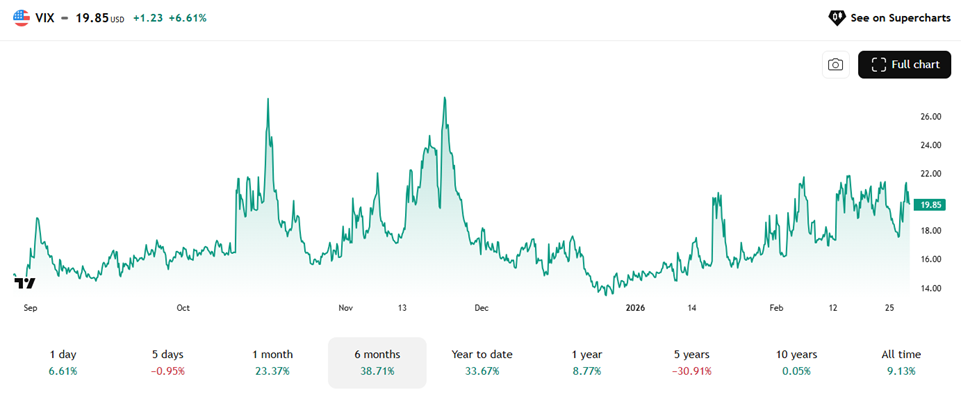
That was the tale of the February tape. Perhaps the most ironic piece of it all is that the S&P 500 has gone nowhere while the Cboe Volatility Index (VIX), Wall Street’s fear gauge, hovered at elevated levels throughout the month. Often, when the SPX is close to all-time highs and merely oscillating, day-to-day volatility is muted. That’s not the case today.
Consider all the curveballs investors faced in recent weeks: a key Fed meeting, hot inflation data, a disappointing Q4 GDP report, big tech earnings, a so-called SaaSpocalypse, the Supreme Court ruling against President Trump’s tariffs, and new “cockroaches” creeping into the embattled private credit market. Volatility has now arrived amid yet another targeted attack on a foreign adversary.
VIX: Gradually Rising in Early 2026
Source: TradingView
Are the headlines—at times—rattling? Yes. Is there chaos? To an extent. Should you be worried about how your portfolio will perform? No. That’s easier said than done, to be sure. Keep in mind that “corrections,” or 10% stock market declines, are very normal. In fact, they happen about once per year, with the average intra-year drawdown being 14%. During midterm election years, that figure is closer to -18%.
Unless you are sitting on a mountain of cash (timing the market), such drops are not fun. Predicting them—selling at the top and buying at the exact bottom—is impossible. And we don’t have to go back far to recall how fickle, scary, and then lucrative they can be.
S&P 500 Annual Returns and Average Yearly Drops
Source: J.P. Morgan Asset Management
We guarantee that many investors were so freaked out a year ago that they sold stocks in anticipation of a trade-war-induced market crash. Guess what happened? They were correct—for about five weeks. The S&P 500 plunged 15% in short order, with some of the most gut-wrenching volatility since March 2020 and the 2008 Great Financial Crisis. Surely feeling vindicated, by Liberation Day in early April 2025, they may have mocked investors who stayed the course (riding stocks down).
Markets turned on a dime just a few days later, soaring 10% on April 9. As fast as stocks dropped, they snapped back even more quickly. As we have detailed, that left the market-timers sitting in cash—likely to this day. Now, as stocks oscillate and new fears emerge, those still-skeptical investors could act as fuel for an eventual rally. While nobody knows what will happen, markets tend to “climb a wall of worry.” And there is no shortage of risks and concerns heading into the spring.
What do we think is among the most ominous signals? The bond market. Falling interest rates were a welcome development last year, but the yield drop has turned worrisome. When fears over economic growth tick up, Treasury rates often decline as investors shift into safety-first mode. Hopes for stronger GDP early this year haven’t quite materialized—the Q4 report was disappointing, and softening consumer spending numbers may weigh on first-quarter GDP.
Q4 GDP Muddled by Trade Data
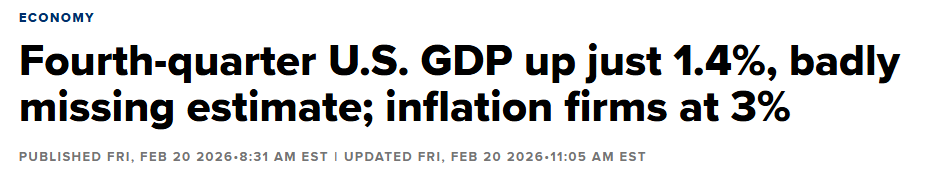
Source: CNBC
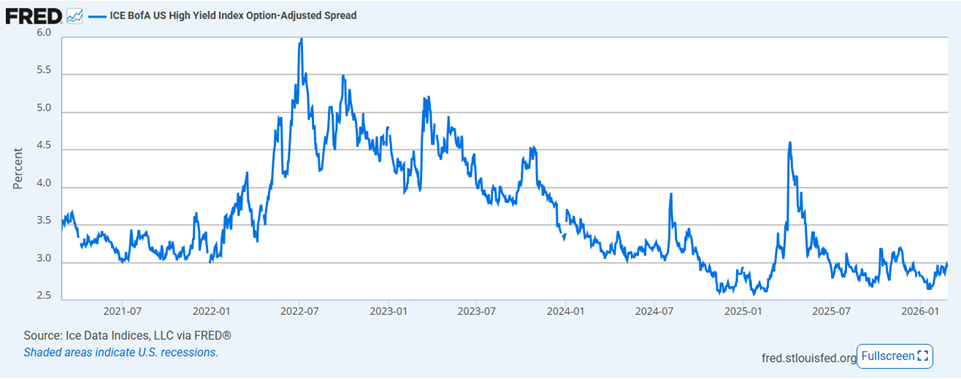
Treasury trends are one thing. Another is a flare-up in corporate credit risk. Yield spreads get into the bond-market weeds, but it’s clear that there has been a bump in the premium investors demand to own riskier corporates compared to default-risk-free Treasurys.
Often seen as a leading market indicator, a further widening of credit spreads would make the bears salivate.
Junk Bond Yield Spread Ticks Up, Still Historically Low
Source: FRED
In the stock market, sector price action waves its own yellow flag. While it’s true that the majority of S&P 500 sectors rose 6% or more in February, a few defensive areas stood out. Utilities, for instance, soared 10%, nearly recording their best month since 2002. Consumer Staples—another cautious corner—jumped to an all-time high as well. Real Estate also rose much more than the broader index.
Lagging were some of the bull market’s winners: Financials, Information Technology, Communication Services, and Consumer Discretionary. Those four sectors largely carried the S&P 500, and with them on the proverbial bench, the U.S. stock market is vulnerable to a correction.
Role Reversal: New Sector Leadership as Tech & Financials Slip
Source: Stockcharts.com
It’s not all doom and gloom. Year-to-date strength from U.S. small- and mid-cap stocks points to optimism in the “real” economy—think Main Street, not Wall Street or Silicon Valley. Sectors like Energy, Materials, and Industrials are nothing short of on fire. What’s more, a key January manufacturing survey ticked into expansion mode for just the second time since Q3 2022.
Bulls will say this is the “rotation trade” in action—the baton being passed from the Mag 7 and big banks to smaller, more economically sensitive companies.
ISM Manufacturing Survey > 50
Source: Trading Economics
Take it a step further: it’s simply difficult to have a long-lasting decline when so many global stock markets are in full flight. Among 45 country funds, just four are down year to date. The median performer is up 8% over the first two months of the year. So, portfolios with a dash of international exposure have done just fine. Toss in a U.S. SMID-cap position, and returns have been even better.
Looking ahead, this Friday is impactful for the macro outlook, as we’ll get the February jobs report and January retail sales numbers. Economists expect 60,000 jobs created last month, while forecasts are tepid for early-year consumer spending. The Fed will certainly parse the data, but it would likely take very weak reports to force a rate cut later this month when the Federal Open Market Committee gathers on March 18.
A quarter-point ease is possible in April, but odds are higher for a June cut. That’s also when Kevin Warsh is presumed to succeed current Fed Chair Jerome Powell.
Two Rate Cuts Expected This Year, 1-in-4 Chance of an Ease by May
Source: CME Fed Watch Tool
Fed members must also keep a close eye on developments surrounding AI. Markets are pricing in significant disruption—software stocks are down 30% or more from their respective 52-week highs. The iShares Expanded Tech & Software ETF (IGV) went from a price-to-earnings multiple above 40x a few months ago to the low 20s today.
Names like Salesforce, ServiceNow, Intuit, Adobe, ADP, and even IBM have come under pressure. Value investors must be licking their chops, while growth and momentum traders want nothing to do with these fallen angels.
Software P/E Multiple Craters Amid AI Disruption Fears
Source: Goldman Sachs
The new theme is the “HALO” trade, or taking a close look at “heavy-asset, low-obsolescence” companies. These businesses rely on tangible, physical infrastructure—such as pipelines, power grids, railroads, machinery, or factories. They are the opposite of once-darling “asset-light” companies (e.g., software-as-a-service providers that populate the IGV ETF). Selling products or services unlikely to be replaced by emerging technologies, they are, for the moment, seen as AI-immune safe havens.
Stocks such as ExxonMobil, GE Aerospace, John Deere, Union Pacific, Johnson & Johnson, FedEx, and even McDonald’s may fall under the HALO moniker. The problem is that areas like Energy, Aerospace & Defense, Railroads, Pharma, and Utilities now trade at historically rich valuations.
The upshot: yes, there has been an outperformance shift, but there’s no free lunch. Momentum says go with HALO. Buffett-style value says search for babies thrown out with the bathwater in software tech. To put it in perspective, Consumer Staples are now cheaper on an earnings basis than the Mag 7.
The Mag 7 Are Cheaper than Low-Growth Consumer Staples
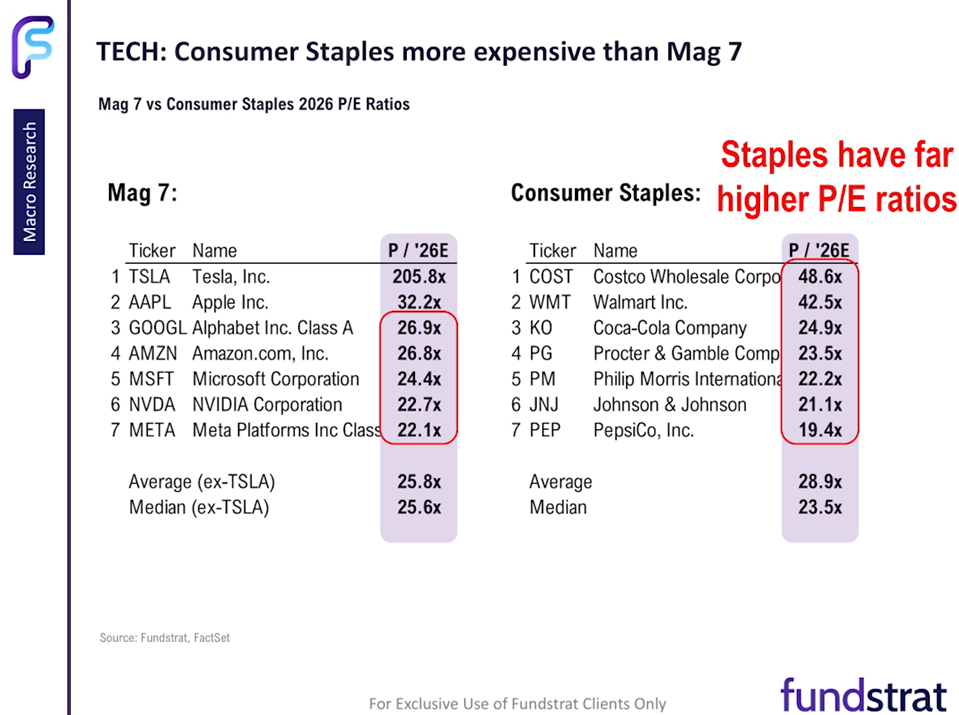
Source: Fundstrat
Stories aside, major U.S. corporations are firing on all cylinders. According to FactSet, 2025 realized S&P 500 earnings per share rose to a record high above $270. For the current year, forecasts have likewise never been higher, with analysts expecting a robust 14.7% earnings increase.
Peek into 2027, and another 16% profit pop is projected. With all the Mag 7 and software handwringing, companies are doing what they do best: delivering value to shareholders in the form of earnings, dividends, and stock buybacks.
S&P 500 Earnings Keep Climbing
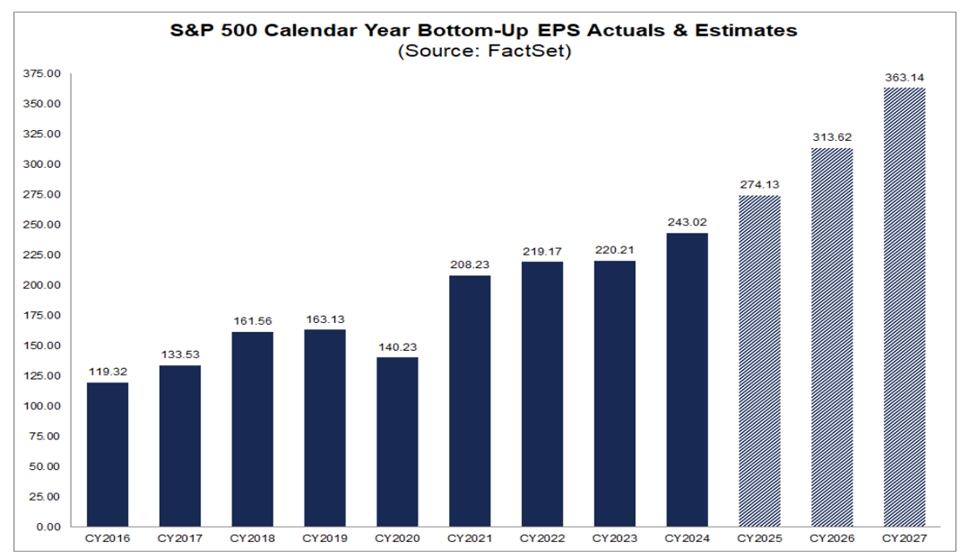
Source: FactSet
The Bottom Line
The S&P 500 was little changed in February, and the Dow Jones Industrial Average barely secured its 10th straight positive month. The ho-hum price range for U.S. large caps contrasted with very strong returns among domestic SMID caps and international stocks. Treasury yields fell notably, perhaps on growth fears and disinflationary AI impacts. The Mag 7 slid, while Main Street stocks rose to new highs.
Going forward, March tends to be a decent month, but we’ve seen late-Q1 volatility in recent years. All eyes will be on the latest AI announcements, geopolitical developments, and a wave of economic data crossing the wires in the days ahead.